How to set up Funnel Analysis for E-Commerce
Understanding how to perform a proper funnel analysis is key for optimizing the customer journey for any ecommerce shop. We explain all you need to know.

As an eCommerce business owner or marketer, you know how important it is to optimize your sales funnel for increased conversions and revenue growth. With funnel analysis, you can identify bottlenecks in your customer journey and take action to improve your conversion rates.
Throughout this tutorial, we'll guide you through the process of setting up funnel analysis for your eCommerce business. We'll cover the fundamental concepts of funnel analysis, the tools you'll need to get started, and the step-by-step process of creating a customized sales funnel that's tailored to your specific business needs.
By the end of this tutorial, you'll have gained a clear understanding of how to effectively track and optimize your sales funnel, ultimately driving more conversions and accelerating your eCommerce business growth.
The wrong way to think about funnel analysis vs. the better way
The wrong way is easy to explain. If you think about funnel analysis as just another KPI that you might want to optimize to drive sales then you are very unlikely to actually succeed.
Better get into the mindset that a funnel analysis is a tool that helps you understand how users and customers navigate through your virtual store. Instead of moving through corridors and aisles and ultimately to a cash register, they start on a page might move back and forth and ultimately you'll want them to finalize the checkout process with the highest possible net-worth bouquet of products.
If you do it right, the analysis will be provide valuable insights, where your page can be improved, and how you can optimize the user journey from start to end. If done right this will improve not just one but most of your other KPI's.
The most basic funnel analysis

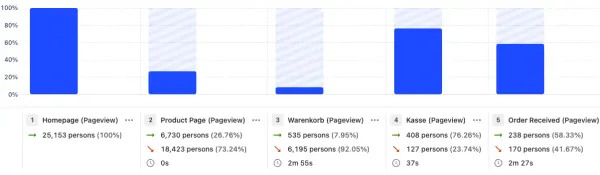
For the basic funnel analysis you'll want to map out the typical (linear) journey you think your customers should go through.
For most ecommerce stores this will be mostly similar, but some variations apply depending on how you set your store up. The typical steps include:
- Homepage
- Category Page (sometimes skipped)
- Product Page
- Shopping Cart Page
- Checkout / Payment Page
- Order Confirmation Page
For typical web shops you can identify each step by filtering the page views of your analytics provider with the URL. For example the product page would match all page views, where the URL includes ```/products/```.
Most analytics tools provide a ready to use funnel analysis visual for this purpose. It will show you the amount of events for each step, as well as the number/percentage of people that drop-off (i.e. complete step 2 but never reach step 3). We really like Posthog for our own analytics and our client implementations because it's open-source and very versatile. More on that later.
Limitations of basic funnel analysis:
It's really important to understand when this basic analysis fails.
Firstly, it's a linear analysis. That means it has limited / no understanding for people that go in circles or do not follow the predefined order of steps. People that did not complete any of the previous steps will not show up in the later steps. That means your assumption on the order of steps is critical, if you get this wrong the analysis will not be very helpful.
Secondly it doesn't differentiate between different cohorts that visit your page. People coming from ads to a specific landing page typically have a different journey than organic traffic or other sources. The more channels you work on the more complex this becomes. If you use different (sub)domains along your journey like we do for Codesphere a simple linear analysis will reach it's limits rather quickly.
Let's see what we can do about that next.
Next iteration: funnel analysis with breakdowns
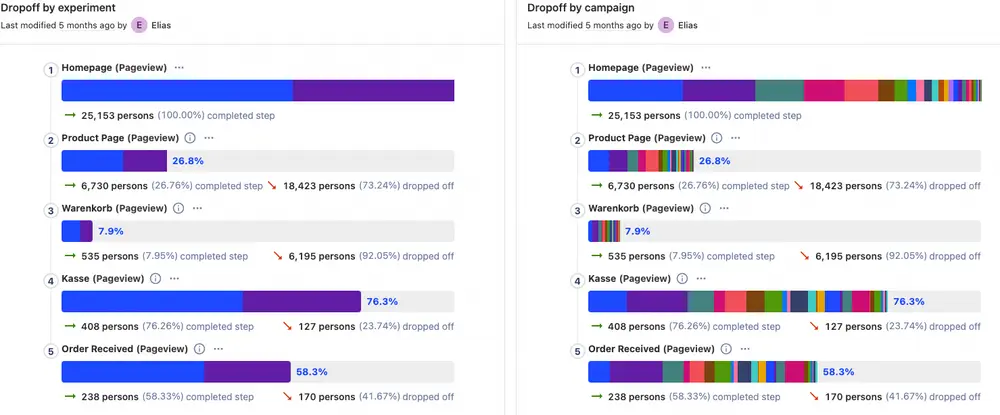
As mentioned the performance and movement through steps can be different for different cohorts. Any serious analytics tool will allow you to add breakdowns.
A breakdown will split the number of people in each step by any categorical variable you choose. This allows you to look if there is a difference in drop-off rates between say people from an ad campaign vs. those that come from a Google search or any other source you identify. Again be careful with the interpretation, differences in drop-off rates could mean two things. Either one cohort / group performs better or worse or the steps (order and included / skipped steps) is a better or worse fit for that specific group. It might be hard to identify which one it is because of the linearity but it will provide a great starting point for further drilldown.
From these basic analyses you can already identify steps that you want to improve i.e. because the drop-off seems abnormally high (often for standard e-commerce funnels you can find industry average drop-off rates per step). If your flow is special usually you will still have a gut feeling of what an appropriate drop-off rate might be.
Also monitoring these over time will be helpful. Often you will change a lot of things and the impact of each will be hard to keep track of, these funnels will give you a feeling if you are overall improving or not.
Up next: non linear analyses (i.e. following real user paths)
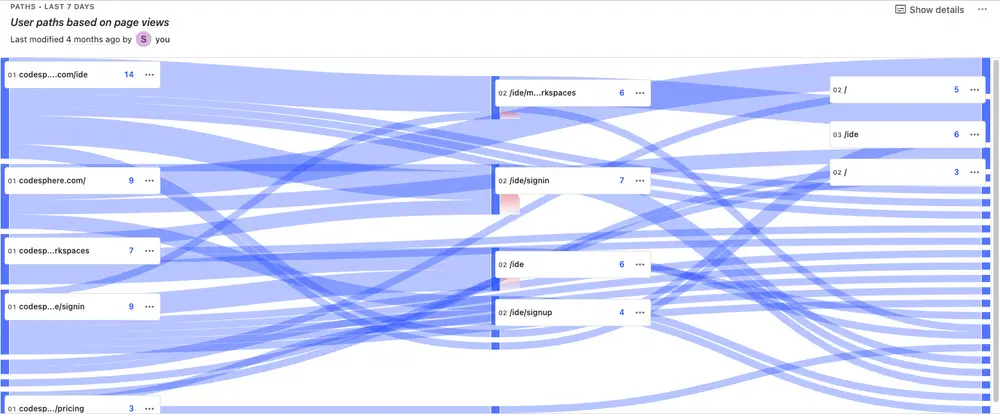
How can we overcome the linearity issues with the previous analyses? Well we need to actually follow the steps each user takes, and analyze patterns that emerge from these journeys. In Posthog this feature is called user paths. The amazing thing is for this we do not need predefined steps and no order.
The algorithm will just check how people move through your site and group them by paths. The main challenge compared to previously is that this can get complex and hard to interpret quickly. Also for some paths you will want to define so called wildcard groups. An example of this would be group all nodes with /product/XYZ* together, otherwise each product page would be a singular path, creating unusable patterns. Same would true for account pages like /user/user1234 if you have many users.
Take for example our slightly simplified Codesphere path analysis above. The thickness of a line indicates how many people a path contains. The red marking indicate the amount of people that end at a specific node. The picture that emerges can be really helpful in identifying hurdles or problems in your user journey and provide a starting point for further drill-down i.e. watching session recordings or even interview real users.
Best Tools for Funnel Analysis
We are only going to do a short expert here, on tools we use and have used in the past with a short pro and contra list. Hopefully this provides a good starting point, if there is interest I'm happy to do a more thorough article in the future.
All these tools need a simple script to be added to your site to start collecting data, setting up the actual visual is usually prette intuitive and documented well.
Posthog (currently our go to at Codesphere)
+ open-source
+ really cheap (unless processing millions of events a month)
+ comprehensive suite of visuals
- it's a bit more complex to get the hang of
- not every integration comes out of the box
Mixpanel (our previous tool)
+ easy to get started
+ looks really clean even on complex visuals
- more expensive
- backend tracking limited, no session recording
+ Integrated with literally anything
+ Easy to use
- limited functionality (no user paths, no
Let me know what you think of this post in the comments!